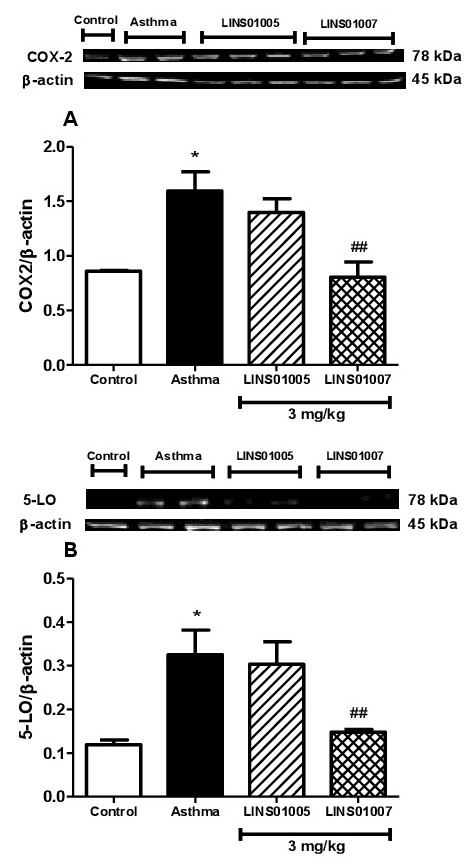
Fig. 3. Effect of treatment with LINS01005 and LINS01007 on the COX-2 and 5-LO expression. Lungs were collected 24h after the second challenge to quantify the expression of COX-2 and 5-LO by Western Blot. Graphs represent the density values of bands that were determined by densitometric analysis and normalized by the total actinin or β-actin present in each lane. Results are the mean ± S.E.M. of 5 animals in each of 3 independent experiments. *p<0.01 in comparison with the control group and ## p<0.05 in comparison with the asthma group.